Content from Introduction to quality assurance and quality control
Last updated on 2025-09-23 | Edit this page
Estimated time: 12 minutes
Overview
Questions
- Why is managing data quality important?
- What is the role of data quality assurance and quality control in the data lifecycle?
- How do you address data quality in work?
Objectives
- Describe the role of quality assurance and quality control in the data life cycle
- Recognize common issues that occur with human- and sensor-collected datasets
- Explain resources available at the USGS to support data quality
- Reflect on processes that you use to address data quality
Introduction
Quality assurance and quality control are both components of the data life cycle. Quality assurance focuses on preventing errors by taking steps during and before data are acquired or collected, while quality control evaluates data to determine whether they are correct, complete, and consistent.
We use the USGS model of the data life cycle, but there are various models of data life cycles.
Data collected by USGS hydrologists on freshwater water quality is likely to undergo both quality assurance and quality control. For this type of data, quality assurance steps could include:
- training in standard field methods
- designing data templates
- backing up datasets
Quality control steps could include:
- evaluating a dataset for missing values
- checking for issues with data that is out of range
- flagging errors
In 1-2 sentences, describe a dataset that you work on or that you are familiar with. Then, list 4-5 data quality issues that could arise while working with this data.
Challenge 1: Quality assurance vs. quality control?
Review a USGS resource, such as the Data Management webpage. Differentiate between quality assurance and quality control by sorting tasks (from McCord et al. 2021) under the header of one or another activity.
- document errors
- develop data management plan
- record metadata
- review data
- check calculations using data
- track methods
| QA | QC |
|---|---|
| develop data management plan | document errors |
| record metadata | review data |
| track methods | check calculations using data |
Challenge 2: Am I using these code chunks correctly?
What do your data look like?
R
str(cars)
‘data.frame’: 50 obs. of 2 variables: $ speed: num 4 4 7 7 8 9 10 10 10 11 … $ dist : num 2 10 4 22 16 10 18 26 34 17 …
- Managing data quality supports scientific research, data releases, and communication
- Quality assurance focuses on preventing errors by taking steps during and before data are acquired or collected, while quality control evaluates data to determine whether they are correct, complete, and consistent
- Run
sandpaper::check_lesson()to identify any issues with your lesson - Run
sandpaper::build_lesson()to preview your lesson locally
Content from Episode 3 - Understanding your data
Last updated on 2025-09-23 | Edit this page
Estimated time: 12 minutes
Overview
Questions
- How do you start to think critically about a dataset from a QA/QC perspective?
Objectives
- Explain the importance of establishing a mental model of a dataset
- Define/differentiate the data types in a dataset
- Compile a set of potential validation parameters for a dataset
Introduction
This is a lesson created via The Carpentries Workbench. It is written in Pandoc-flavored Markdown for static files and R Markdown for dynamic files that can render code into output. Please refer to the Introduction to The Carpentries Workbench for full documentation.
What you need to know is that there are three sections required for a valid Carpentries lesson template:
-
questionsare displayed at the beginning of the episode to prime the learner for the content. -
objectivesare the learning objectives for an episode displayed with the questions. -
keypointsare displayed at the end of the episode to reinforce the objectives.
Inline instructor notes can help inform instructors of timing challenges associated with the lessons. They appear in the “Instructor View”
Juneau Ice Fields Weather Station: How do you QA/QC?
Read over the readME file for The [Juneau Icefield Weather station data] (https://www.sciencebase.gov/catalog/item/5d5b13f9e4b01d82ce8ed3be). What quality control procedures do the authors employ for the different data types? Alone or with a partner, Think about types of data you commonly work with and create a list of checks you do or may employ for those data.
Figures
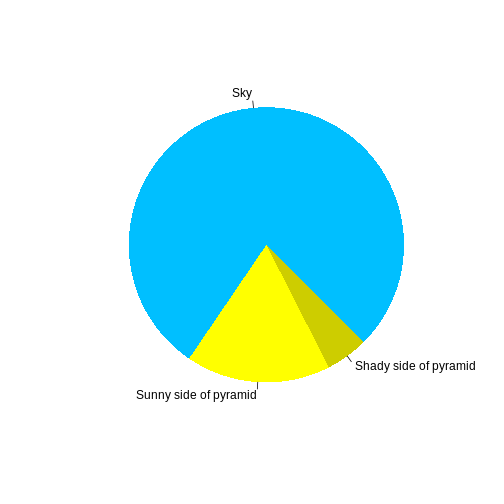
You can also include figures generated from R Markdown:
R
pie(
  c(Sky = 78, "Sunny side of pyramid" = 17, "Shady side of pyramid" = 5),
  init.angle = 315,
  col = c("deepskyblue", "yellow", "yellow3"),
  border = FALSE
)

Or you can use standard markdown for static figures with the following syntax:
{alt='alt text for accessibility purposes'}
Callout sections can highlight information.
They are sometimes used to emphasise particularly important points but are also used in some lessons to present “asides”: content that is not central to the narrative of the lesson, e.g. by providing the answer to a commonly-asked question.
Math
One of our episodes contains \(\LaTeX\) equations when describing how to create dynamic reports with {knitr}, so we now use mathjax to describe this:
$\alpha = \dfrac{1}{(1 - \beta)^2}$ becomes: \(\alpha = \dfrac{1}{(1 - \beta)^2}\)
Cool, right?
- Use
.mdfiles for episodes when you want static content - Use
.Rmdfiles for episodes when you need to generate output - Run
sandpaper::check_lesson()to identify any issues with your lesson - Run
sandpaper::build_lesson()to preview your lesson locally
Content from Data types and importing data with R
Last updated on 2025-09-23 | Edit this page
Estimated time: 0 minutes
Overview
Questions
- Why is it important to understand what types of data you are working with?
- How are data imported into R?
Objectives
- Import data from multiple sources
- Identify and describe different data types
- Identify common errors
Introduction
In the lesson, the instructor will demonstraite how to read data using R, introduce the basic data types, and demonstrate common issues that may be associated with each data type. This will familiarize learners with the RStudio GUI, common data structres, and build the foundation for addressing common data QA/QC.
What you need to know is that there are three sections required for a valid Carpentries lesson template:
-
questionsare displayed at the beginning of the episode to prime the learner for the content. -
objectivesare the learning objectives for an episode displayed with the questions. -
keypointsare displayed at the end of the episode to reinforce the objectives.
Inline instructor notes can help inform instructors of timing challenges associated with the lessons. They appear in the “Instructor View”
Challenge 1: Using R, open the provided dataset and answer the following information:
How many records and columns are in the dataset?
How many different types of data are in the dataset and what are they?
R
df <- read_csv(file_name.csv)
str(df)
OUTPUT
[1] "This new lesson looks good"Challenge 2: Can you identify any issues with the dataset?
You can add a line with at least three colons and a
solution tag.
Figures
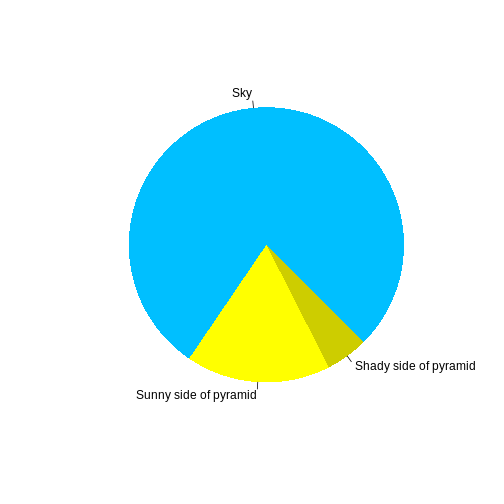
You can also include figures generated from R Markdown:
R
pie(
  c(Sky = 78, "Sunny side of pyramid" = 17, "Shady side of pyramid" = 5),
  init.angle = 315,
  col = c("deepskyblue", "yellow", "yellow3"),
  border = FALSE
)

Or you can use standard markdown for static figures with the following syntax:
{alt='alt text for accessibility purposes'}
Callout sections can highlight information.
They are sometimes used to emphasise particularly important points but are also used in some lessons to present “asides”: content that is not central to the narrative of the lesson, e.g. by providing the answer to a commonly-asked question.
- Use
.mdfiles for episodes when you want static content - Use
.Rmdfiles for episodes when you need to generate output - Run
sandpaper::check_lesson()to identify any issues with your lesson - Run
sandpaper::build_lesson()to preview your lesson locally
