Episode 3 - Understanding your data
Last updated on 2025-09-23 | Edit this page
Estimated time: 12 minutes
Overview
Questions
- How do you start to think critically about a dataset from a QA/QC perspective?
Objectives
- Explain the importance of establishing a mental model of a dataset
- Define/differentiate the data types in a dataset
- Compile a set of potential validation parameters for a dataset
Introduction
This is a lesson created via The Carpentries Workbench. It is written in Pandoc-flavored Markdown for static files and R Markdown for dynamic files that can render code into output. Please refer to the Introduction to The Carpentries Workbench for full documentation.
What you need to know is that there are three sections required for a valid Carpentries lesson template:
-
questionsare displayed at the beginning of the episode to prime the learner for the content. -
objectivesare the learning objectives for an episode displayed with the questions. -
keypointsare displayed at the end of the episode to reinforce the objectives.
Inline instructor notes can help inform instructors of timing challenges associated with the lessons. They appear in the “Instructor View”
Juneau Ice Fields Weather Station: How do you QA/QC?
Read over the readME file for The [Juneau Icefield Weather station data] (https://www.sciencebase.gov/catalog/item/5d5b13f9e4b01d82ce8ed3be). What quality control procedures do the authors employ for the different data types? Alone or with a partner, Think about types of data you commonly work with and create a list of checks you do or may employ for those data.
Figures
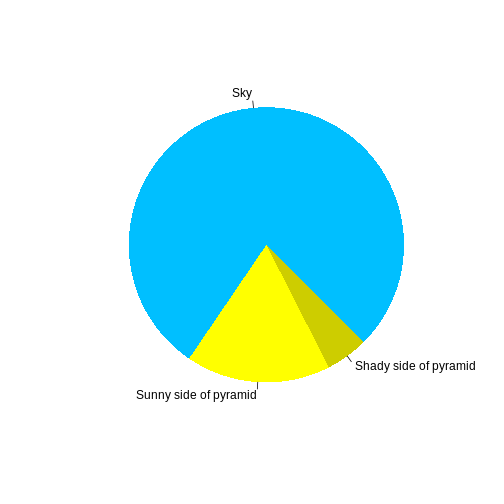
You can also include figures generated from R Markdown:
R
pie(
  c(Sky = 78, "Sunny side of pyramid" = 17, "Shady side of pyramid" = 5),
  init.angle = 315,
  col = c("deepskyblue", "yellow", "yellow3"),
  border = FALSE
)

Or you can use standard markdown for static figures with the following syntax:
{alt='alt text for accessibility purposes'}
Callout sections can highlight information.
They are sometimes used to emphasise particularly important points but are also used in some lessons to present “asides”: content that is not central to the narrative of the lesson, e.g. by providing the answer to a commonly-asked question.
Math
One of our episodes contains \(\LaTeX\) equations when describing how to create dynamic reports with {knitr}, so we now use mathjax to describe this:
$\alpha = \dfrac{1}{(1 - \beta)^2}$ becomes: \(\alpha = \dfrac{1}{(1 - \beta)^2}\)
Cool, right?
- Use
.mdfiles for episodes when you want static content - Use
.Rmdfiles for episodes when you need to generate output - Run
sandpaper::check_lesson()to identify any issues with your lesson - Run
sandpaper::build_lesson()to preview your lesson locally
